
Decoding Connections: Social Network Analysis for Evaluation
Measuring and visualising the number of connections a person has, and the strength of those relationships is an incredibly useful means of understanding systems, processes, and the impact of programs on relationships and networks. In this blog we provide a brief overview of what social network analysis (SNA is), when and how to use it.
To start, a bit of necessary knowledge
A system, according to Donella Meadows, is ‘an interconnected set of elements that is coherently organised in a way that achieves something’.
The programs we evaluate often set out to influence and improve systems: the health system, the aged care system, environmental systems – the list goes on. Individuals, groups, or organisations (collectively referred to as ‘agents’ from now on) within a social system have attitudes, behaviours, and relationships with each other and the system. These impact the outcomes any given program can achieve. Where a program is aimed at influencing change within a system – and especially where the focus is on collaboration and coordination – it often becomes useful to understand these relationships.
But relationships are messy and so are systems. So, how on earth do we make sense of them? Social Network Analysis is a powerful tool because it visualises simply connections that otherwise would be difficult to analyse. This is broadly the aim of SNA.
Why and when to use SNA?
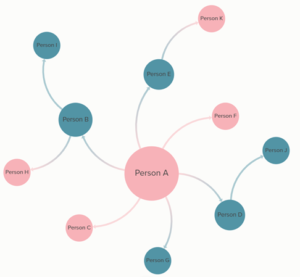
SNA can be used to look at the patterns and implications of relationships between agents. It’s a method that uses mathematical descriptions that are often translated to visual maps. The result is an illustration of the system’s relationships, showing for example, a thicker line between agents with a higher intensity of interaction (generally described by frequency of interactions or quality, for example strength of collaboration).
These maps enable program designers, evaluators and decision makers to more easily recognise patterns and test inferences, and prompt discussions about why X is engaging with Y, or why X isn’t coordinating with Z.
The flexibility of SNA makes it an attractive tool for evaluators.
In our practice, we often utilise SNAs:
- To understand processes: determining who is involved, how they are connected, and what these dynamics mean in the context of the overall evaluation
- To produce an output: understanding strategic planning, program or intervention design
- To demonstrate impacts and outcomes: showing the ways in which networks or systems have change or been adapted
What are the steps?
The approach you take will depend on the questions you want to answer, or the hypothesis you want to test. [1] But there are fairly routine phases we follow:
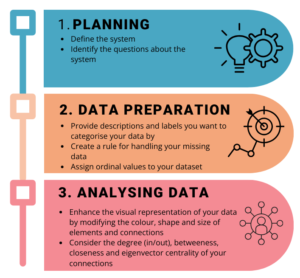
In the planning stage…
Once you have established whether the SNA will be used to understand processes, produce an output, or demonstrate an outcome, it is important to identify the network being analysed. This requires critical consideration of:
- the purpose of the SNA
- the relevant agents within the network
- why they are relevant
Sometimes, the boundary of the system being analysed is confined by the project constraints: how much can you practically analyse with the time, money, and resources dedicated for the analysis, alongside the availability of the agents that may be engaged as part of the network.
Understanding the network and system boundaries informs the questions we set out to answer and the data collection tools we use.
In the data preparation stage…
Taking time to clean the data will ensure the connections between agents are effectively visualised. The step involves careful consideration of:
- treatment of missing data: should connections with missing data be excluded entirely?
- data categorisation: how should the data be segmented? For example, when evaluating the impact of a program designed to enhance connections between leadership and junior staff within an organisation, it may be beneficial to categorise individuals based on their roles and teams.
- managing multiple connections: where agents both comment on their relationship with one another, will the analytical approach be to average the strength or their relationship, or consider them individually?
In the analysis stage…
There are four ways to measure connectedness:
- Degree (in/out): number of connections a person/organisation has – they either have identified relationships with others or have had relationships identified r with them
- Between-ness: the person or organisation that bridges/ connects otherwise isolated clusters or sub-networks
- Closeness: distance between a person/ organisation and the rest of the network – who is the network’s most central person/ organisation?
- Eigenvector: the “celebrity friends” metric. The person/ organisation is connected to other well-connected persons/ organisations
Your decision about which connectedness measure you use depends on the questions you want to answer. For instance, you might use ‘Degree’ to understand the most central point in an organisation, whereas you might use ‘Betweeness’ to understand which node lies on an important path to get to someone.
Experimenting with different data visualisations during the analysis phase helps to ensure the SNA maps produced align with the project’s requirements and are maximally informative! SNA programs such as Kumu, and STICKE2 have options to adjust colour, size, and shape of connections and agents to communicate the strength of relationships or the nature of roles at a glance. We can also use other platforms such as R to develop similar maps.
So what?
A Social Network Analysis is just one method in our evaluative toolbox. The results of the analysis must be interpreted alongside and triangulated with data and insights from other methods. For example, the social network map (here) shows the relationships between individuals in a workplace, by gender. Using it, we can see who has the most connections and the extent of collaboration between male and female colleagues. But, we wouldn’t be able to understand why those patterns exist without additional data such as qualitative interviews or survey data.

References:
[1] https://assets.publishing.service.gov.uk/media/5a819b0640f0b62305b8fdb6/socnet_howto.pdf